The report starts with another export.
Files from separate systems need to be combined each time someone asks for an update.

Zoho Analytics services
Connected reporting, agreed definitions and dashboards built around the decisions your team needs to make.
Talk to a Zoho Consultant
When reporting becomes the work
Start with the question. Then make sure the data can answer it.
Files from separate systems need to be combined each time someone asks for an update.
Teams use different definitions, filters or time periods. The meeting becomes a debate about the numbers.
A headline total is not enough. Your team needs the relevant detail to investigate what happened.
What you can see
Illustrative reporting scenarios, not customer results. The measures and views depend on your data and business priorities.
Bring sales reporting into the review, with definitions your team agrees on.
Review demand and unresolved work together, rather than reading ticket totals in isolation.
Connect relevant sources so the team can examine the same question across systems.
Which question takes your team too long to answer?
Talk to a Zoho ConsultantInside Zoho Analytics
Explore a line chart, sales funnels, a gauge and KPI widgets in Zoho’s sales dashboard example. The figures are Zoho’s sample data, not Zolution or customer results.
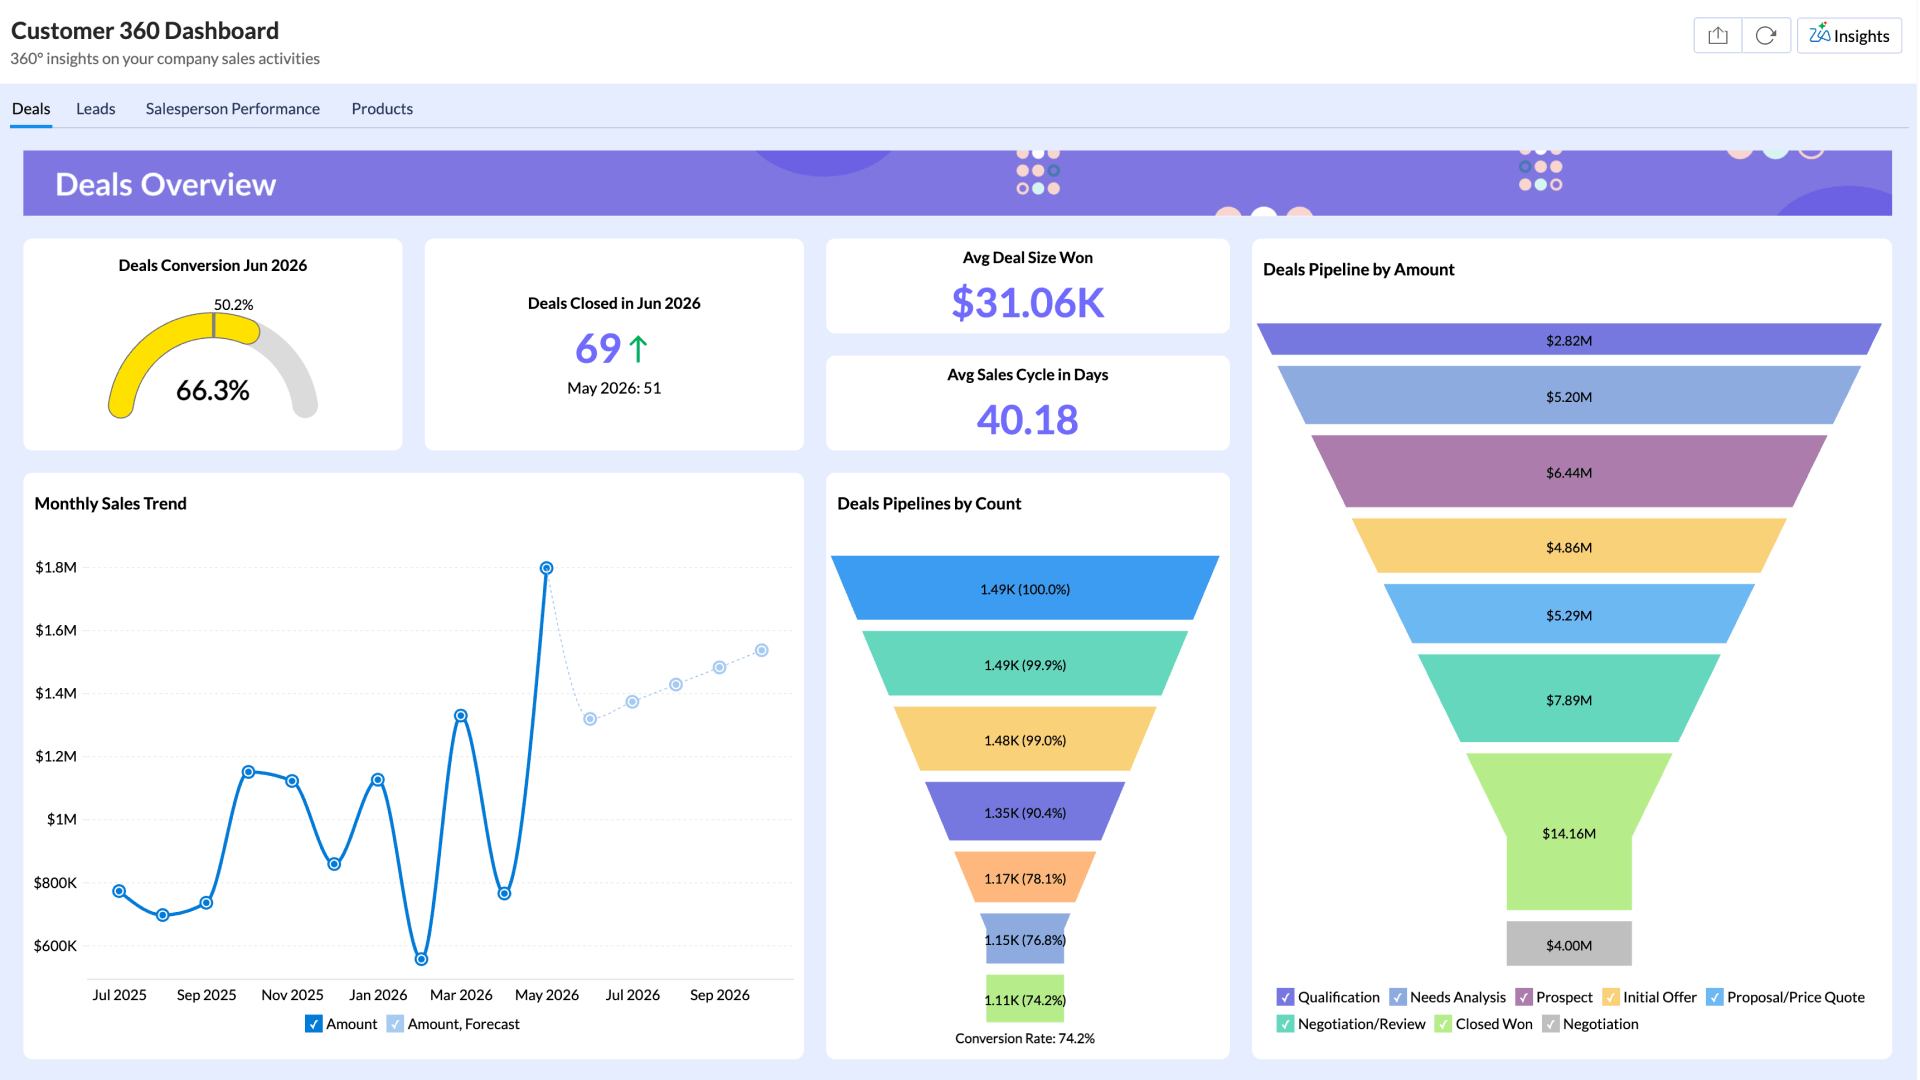
Source: Zoho Analytics official website ↗Official product example, not a Zolution customer project. Interface and features may vary by edition and configuration.
What we configure
Sources & definitions
Identify source systems, record relationships and calculation rules. Decide which source owns each measure.
Reports & access
Build useful dashboards, filters and detail views. Agree who can see which information.
Refresh & ownership
Set the supported refresh schedule, validate results and assign responsibility for source data and report changes.
Connectivity & integrations
Bring supported third-party sources such as Google Ads, Facebook Ads, HubSpot CRM, Shopify and Xero into your reporting alongside Zoho applications.
How we deliver
Start with the questions your team needs to answer and the data available today.
Agree measures, source relationships, access and the reports needed for each review.
Connect and build, then reconcile sample results against the source records with your team.
Walk through the reports with users. Document definitions, refresh expectations and ongoing ownership.
Keep the source process connected
Analytics helps you examine the data. The systems where your team works still need clear processes and ownership.
Before we talk
Zoho Analytics supports business applications, files and databases. We check the specific connector, available fields, permissions and refresh options for your sources before confirming scope.
Yes. We can review the current reports, calculations and source data, then agree which changes will make them more useful for the decisions you need to make.
Not necessarily. Refresh options depend on the source, connection method and plan. We agree a supported schedule and make data freshness clear to users.
We scope sharing and access around the people using each report. The available controls and configuration are checked against your edition and requirements.
We identify the gaps and agree how to handle them. A dashboard does not automatically repair the source process; data owners need to help resolve missing records and inconsistent definitions.
We confirm sources, data volumes, users, refresh needs and report complexity first. That gives us the basis for an edition recommendation and an implementation plan.